Are you starting to see Machine Learning and AI more and more as a necessary or useful skills in job requirements and bewildered by it? Want to know more but don’t know where to start?
There is probably no area of our lives these days not touched in some way by machine learning. Applications cover such wide areas as translation, speech recognition, forecasting, fraud detection, search engines, medical diagnosis, the financial markets, DNA sequencing and weather prediction for agriculture. The breadth of its potential applications is almost as large as the breadth of information technology itself. For this reason and others testers will be expected to have more (at least) conceptual knowledge of machine learning in the future.
This is an essay and tutorial-based version of a talk on Machine Learning I did for the Sydney Testers Meetup Group in March 2021. I am a strong believer that, while machine learning and AI does require some undergraduate-level computer science and mathematics capability to understand well, it is not beyond the capacity of most testers to learn enough to get to a point to at least conversing with data scientists and being “on the same page”. In this regard, I have tried to write an article that allows testers to understand the basic concepts.
What is Machine Learning?
“The use and development of computer systems that are able to learn and adapt without following explicit instructions, by using algorithms and statistical models to analyse and draw inferences from patterns in data…”
Definition from Oxford University Press/ Lexico
The difference between Machine Learning (ML) and other algorithmic methods in computer science is the idea of an application using historical or example data to optimise its actions in some way without instruction. Often some sort of specified inputs and outputs are provided and a program is asked to find relationships between them, however, it is not obligatory and there are ML approaches where the computer develops its own relationships, sometimes with a stated overall goal and some limited feedback.
One point to be made is that Machine Learning and Artificial Intelligence, whilst usually considered synonymous in the media, are actually different things with some overlap. Machine Learning bases much of itself on statistics, an area not considered a part of AI, while AI includes areas not considered part of ML, such as expert systems and inductive logic.
The Machine Learning Timeline
Since it has its roots in the history of statistics, ML can be said to date back to long before the dawn of modern computers, however, most people treat ML as having started in the 1950s. Below is a timeline of important events in ML.
- 1805 – Adrien-Marie Legendre develops the Least Squares Method and thus Linear Regression
- 1951 – Marvin Minsky and Dean Edmonds create the first “neural network” machine. Evelyn Fix and Joseph Hodges create the k-Nearest Neighbour Algorithm
- 1957 – Frank Rosenblatt invents the Perceptron, the basis for all modern neural networks
- 1959 Arthur Samuel coins the term “Machine Learning” for the first time
- 1970-1982 – Backpropagation and the precursors to Convolutional Neural Networks and Hopfield Networks developed
- 1997 – IBM Deep Blue beats Gary Kasparov at Chess
- 2012 – Andrew Ng and Google Brain develop Neural Network to detect cats from unlabelled YouTube images
- 2016 – Google’s AlphaGo beats a professional human player at Go for the first time
The Machine Learning Pipeline
Machine Learning in most places should be considered a process of data retrieval and manipulation. Then “features” (data variables) that can be modelled are extracted, filtered and put into a structure with metadata and parameters known as a “Model”.
This is used to generate some sort of predictive output or classify some data, which is then compared to an expected output. In the case of differences, the model parameters are amended and optimised (a process known as “training” or “learning”) and the process is repeated until the model output matches the expected output adequately
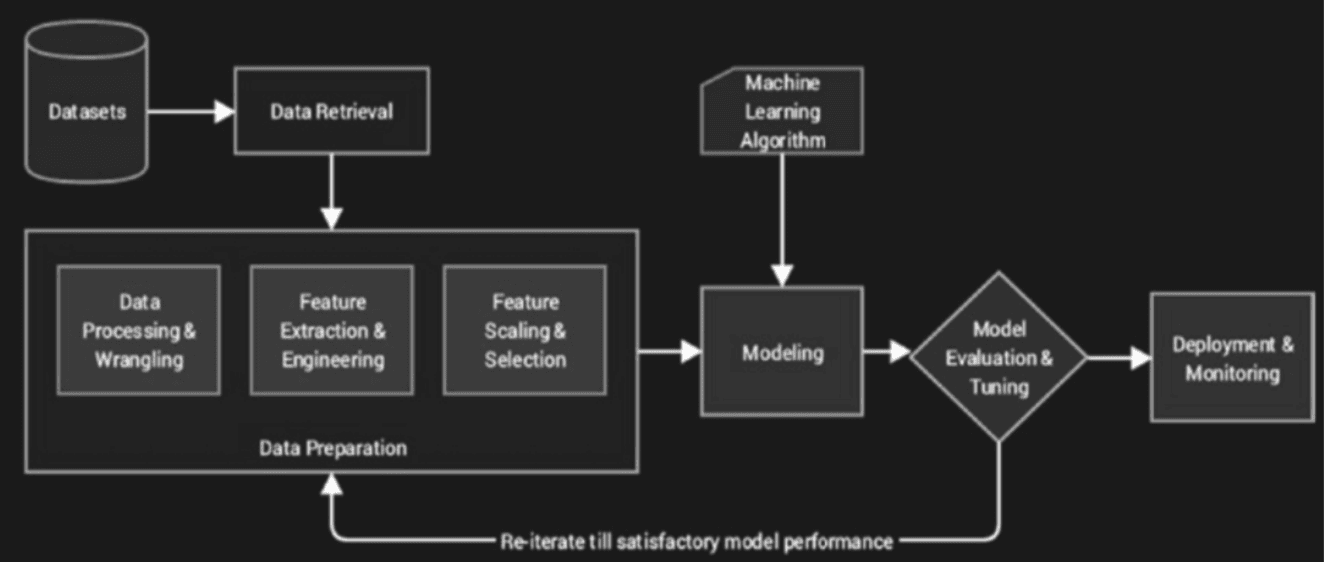
Being a specialised field, the terms of ML should be introduced now since they will be referred to during this essay. They are not difficult to understand at a high level.
- Supervised Learning – Computer given specified inputs and outputs and find relationships between inputs and outputs.
- Unsupervised Learning – No labelled outputs given, computer has to come up with its own relationships from the input data.
- Reinforcement Learning – Computer reacts with a dynamic environment in which it must perform a certain goal. Given “rewards” as feedback, which it has to maximise.
- Model – weights and parameters used by the computer to represent an assumption about the relationship between input and output data.
- Training – Comparing the model to the output and then optimising it to reduce errors.
- Feature – Some variables defined in the input data (i.e. size, colour, age etc.) In addition to the above, ML can be usually broken down into three types.
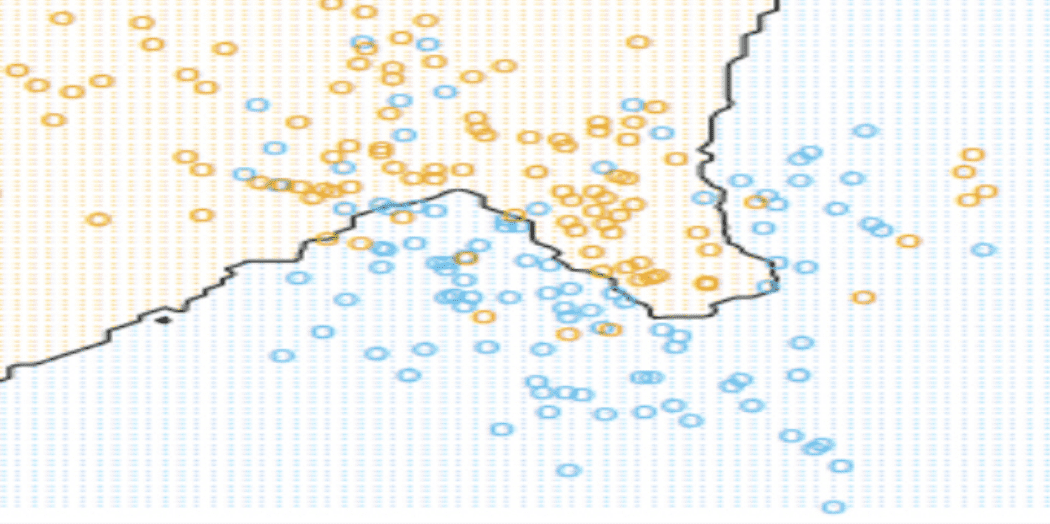
Classification – Estimating which category something belongs to based on a dataset of data already labelled into categories (i.e. classifying animals into dogs, cats, rabbits etc).
On Attribution and the use of Mathematics
It is not possible in my view to write an overview of machine learning that is adequately explanatory without mathematics, so I have had to include some equations. Some knowledge of algebra and calculus will prove useful when reading this. However, I have tried to keep them to a minimum.
For the images and equations in my examples, I have often used Wikipedia. This is because they have either public or creative commons attribution. Where no mention was made it is taken from Shervine Amidi’s Stanford Super ML Cheatsheet https://stanford.edu/~shervine/.
In all other cases, I have included attribution as appropriate.
Machine Learning Techniques
Regression
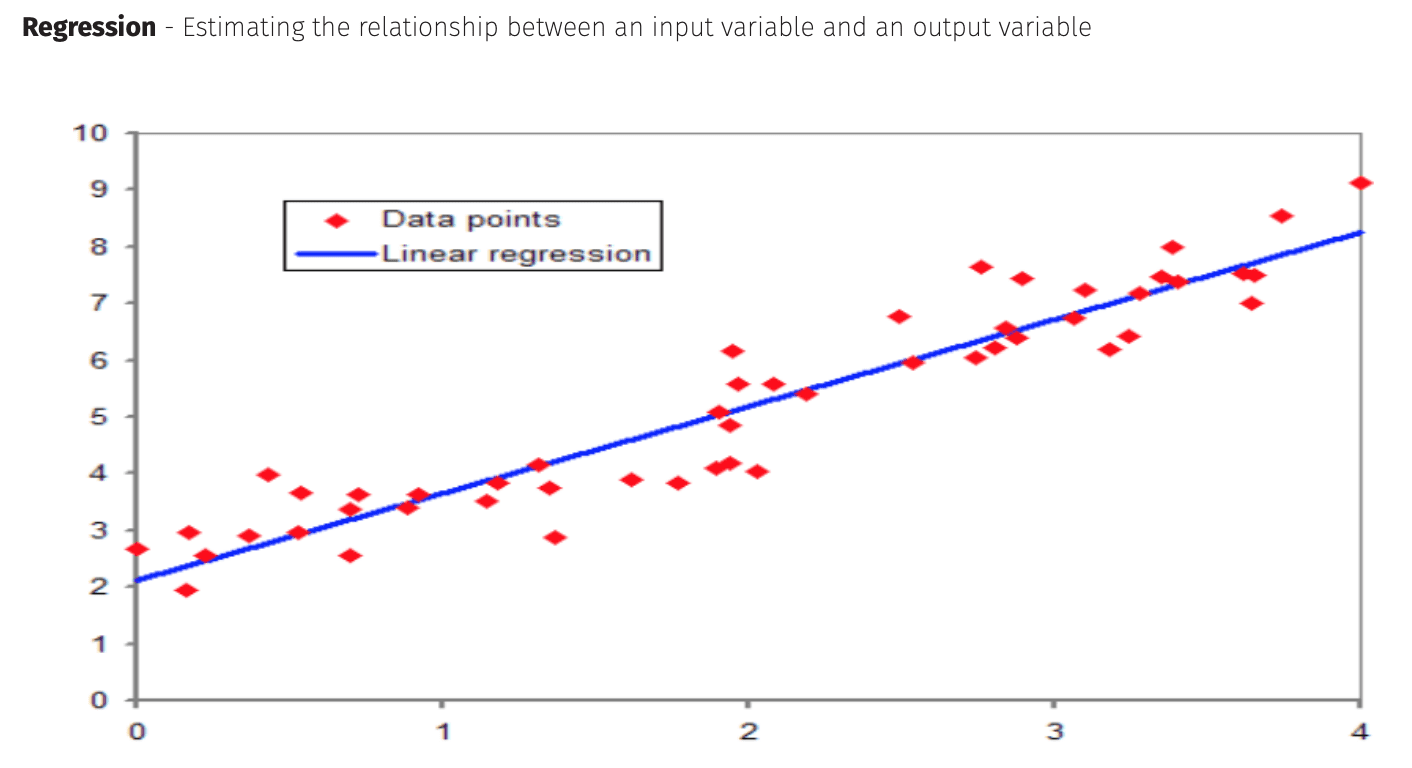
Regression is a technique where one has some sort of numerical input and output data and fits a trendline or curve to it.
Linear Regression – The Most Basic ML Approach
(images, equations and example taken from https://en.wikipedia.org/wiki/Simple_linear_regression)
The most basic technique is Linear (Ordinary Least Squares) Regression, taught in most school statistics classes.
Consider a series of x,y points on a 2-dimensional plane that we wish to model using a straight line.
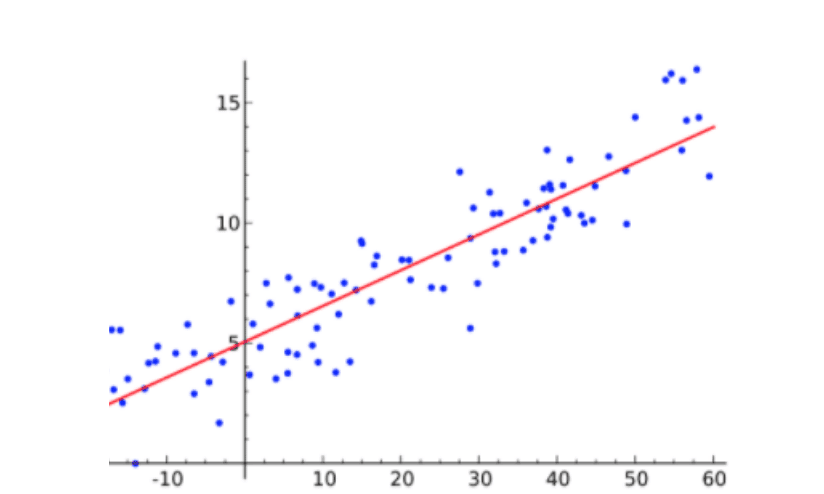
Consider a one dimensional model (where alpha is the intercept across the y axis and beta is the gradient of the trendline) –

..or if we expand to a number of data points i and include the random error term ε

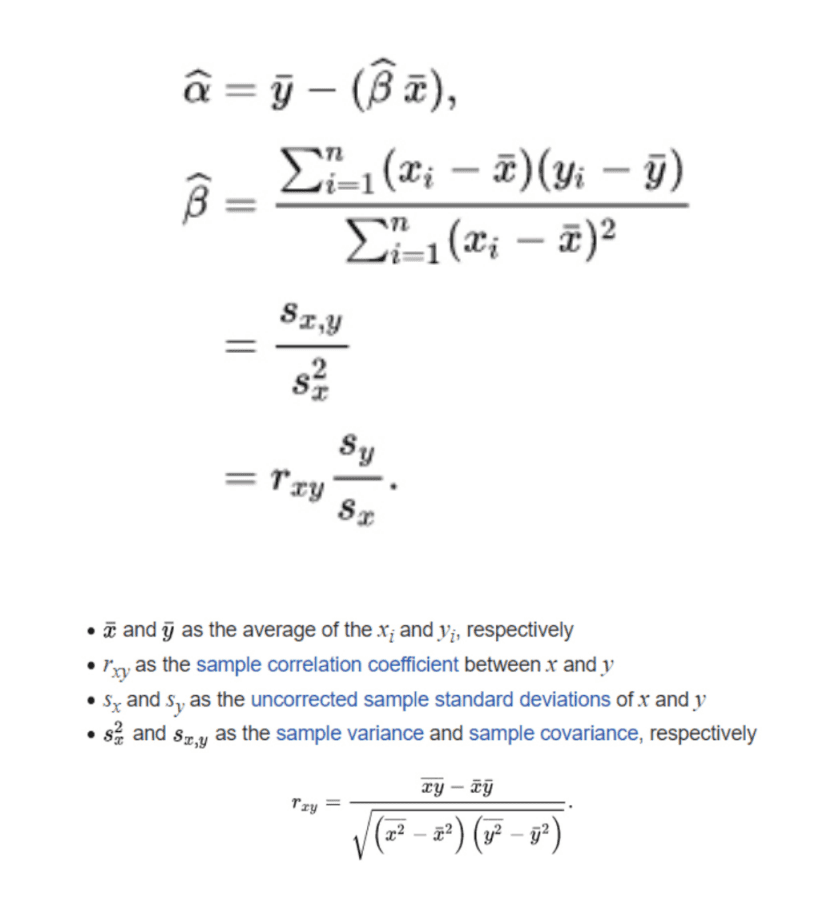
Find the optimum gradient β and y-axis intercept α such that ε is a minimum.

In order to find the minimum we need to solve for optimised gradient β and y-axis intercept α –
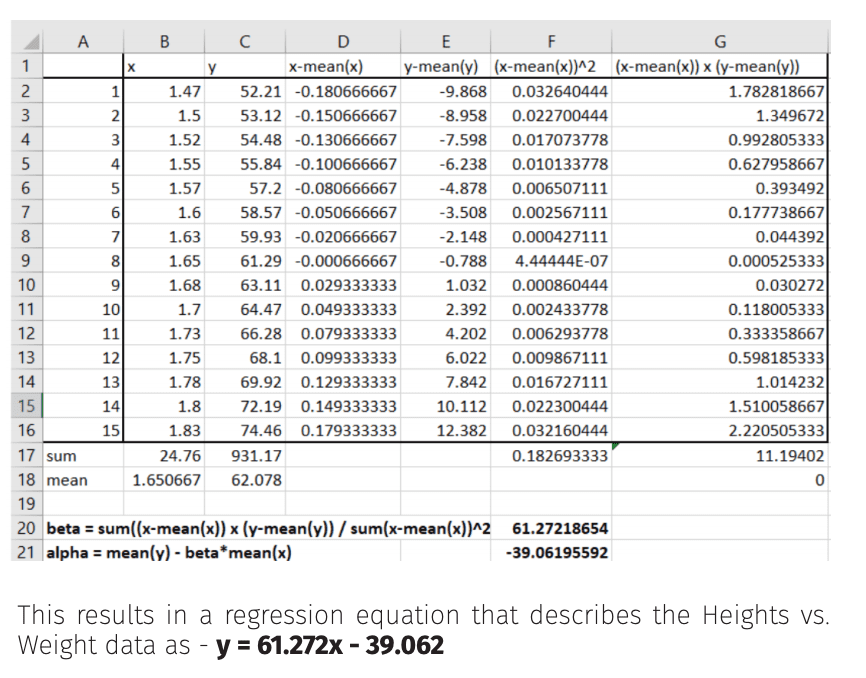
A famous example of this is that of Height vs Mass for a sample of American women.
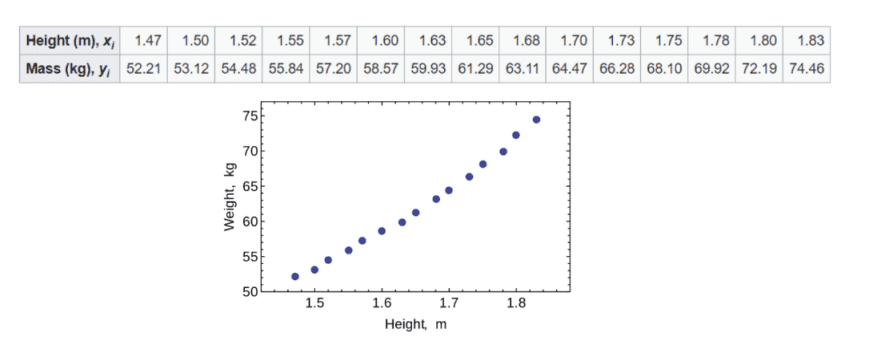
In my original talk I demonstrated this calculated on an Excel spreadsheet as follows,
Non-Linear Regression
(Image and Equations from https://en.wikipedia.org/wiki/ Ordinary_least_squares)
Maybe we decide that the linear regression trend is best described as a curve.
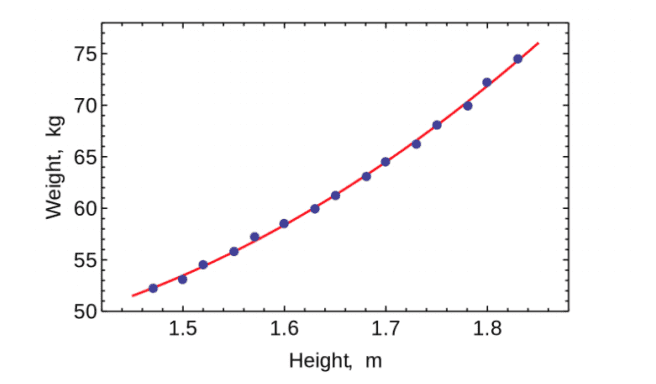
We can apply a curve trendline by using a quadratic function with a new term h2 for height.

!Which a statistical package can be used to reveal the following –
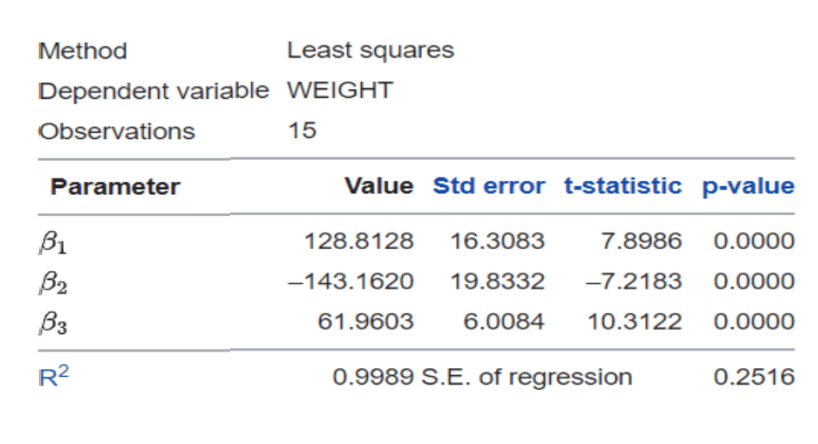
In this way we can extend a linear regression approach to finding non-linear (polynomial) data relationships.
Logistic Regression
Regression can be used for binary classification (i.e. between two classes) if a non-linear separation function (known as the logistic or sigmoid function) is used.
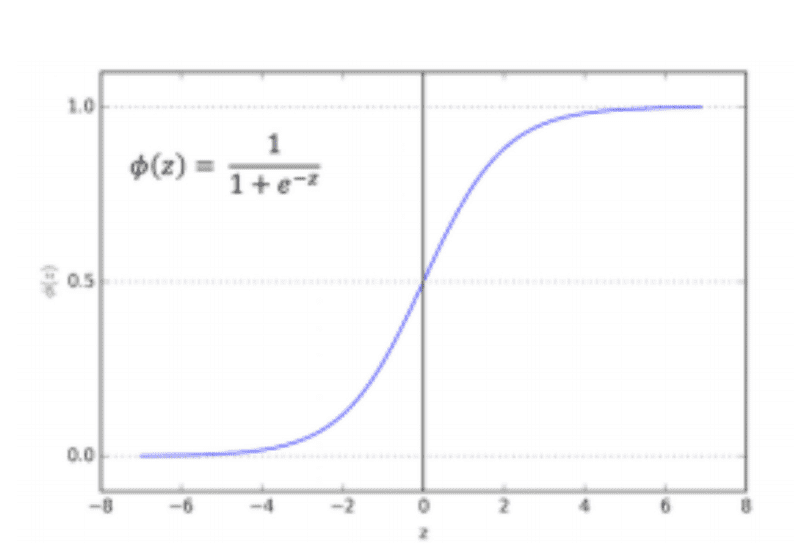
This is trained using a statistical technique called the Maximum Likelihood estimation. It is used for classifying loan customers.
The results is a binary output where the probability “p(i)” of True/ False, Will Default/Will Not Default, Spam / Not Spam is a logistic function where z is the linear sum of data points multiplied by weights along with a bias beta 0).

Clustering
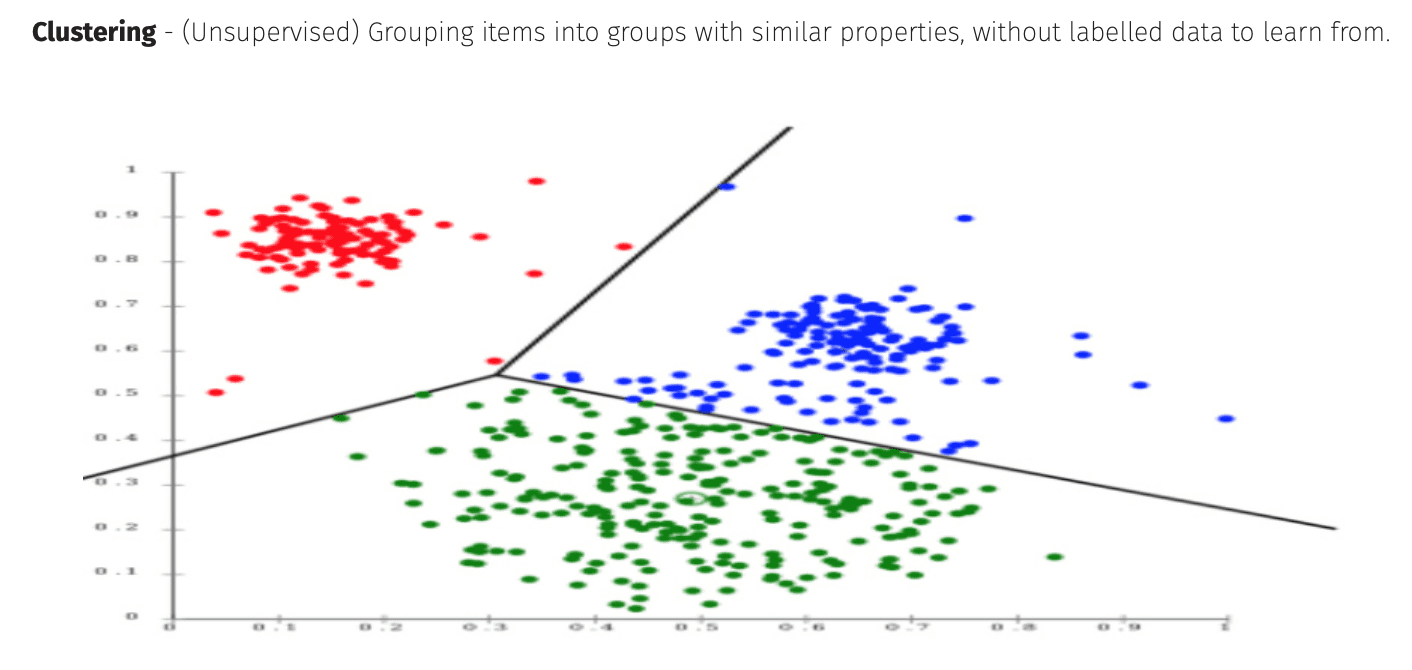
Clustering is an unsupervised learning technique where a computer categorises a set of disparate data points into “clusters” related to some property the data has. It is commonly used in image recognition, computer science and astronomy.
K-Means Clustering
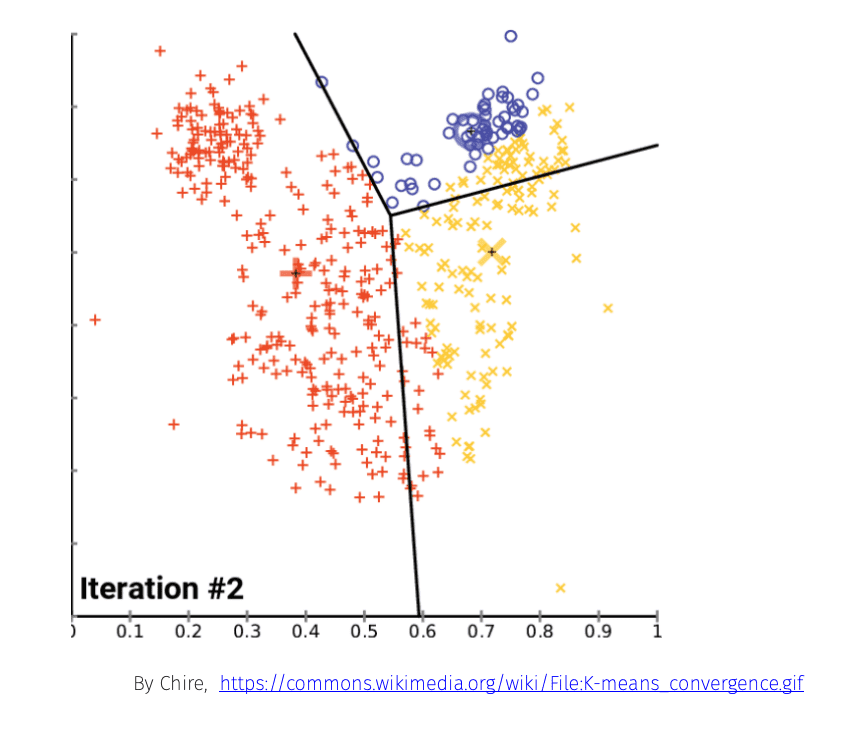
The most common of these, k-means clustering, calculates the mean between points and optimises this until the mean between points converges. It thus classifies the data into a number k clusters.
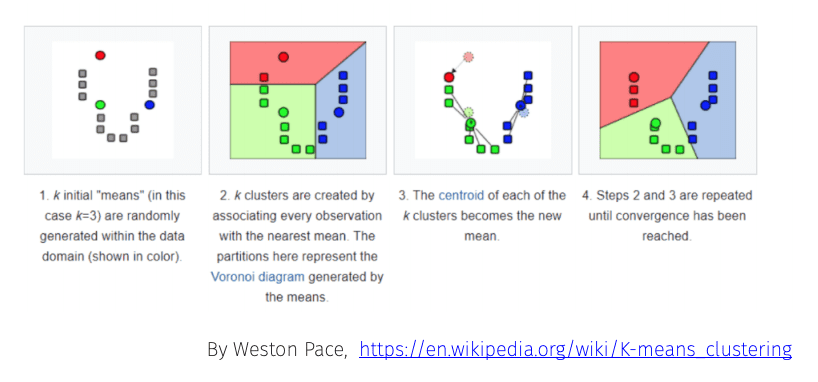
A famous example of this is the (k=3) “Mouse” dataset.
Classification
Classification is a supervised learning process of categorising some data into predetermined sub-populations based on some feature of that data. These could be binary (i.e. spam/not spam), real valued (i.e. length) or categorical (i.e. colour, blood type, type of voter).
Decision Trees
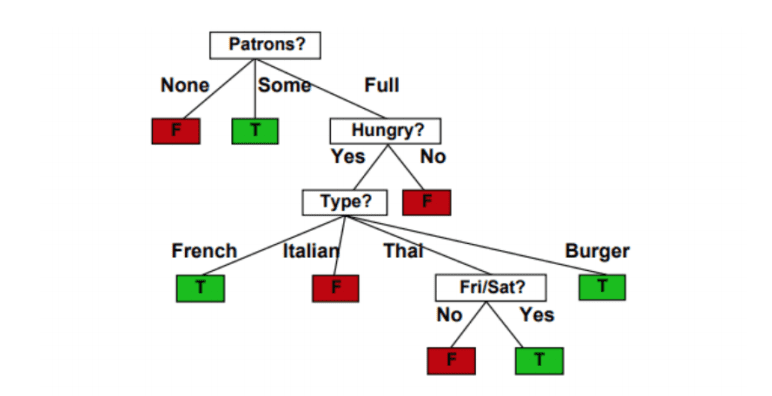
The most intuitive classification method is the decision tree.
The classic example of this taught at the undergraduate level is that of restaurant customers. Because of this, I used data and images attributed to Alan Blair’s AI course at UNSW. In this case, we classify them into whether they are likely to have to wait to be served or not.
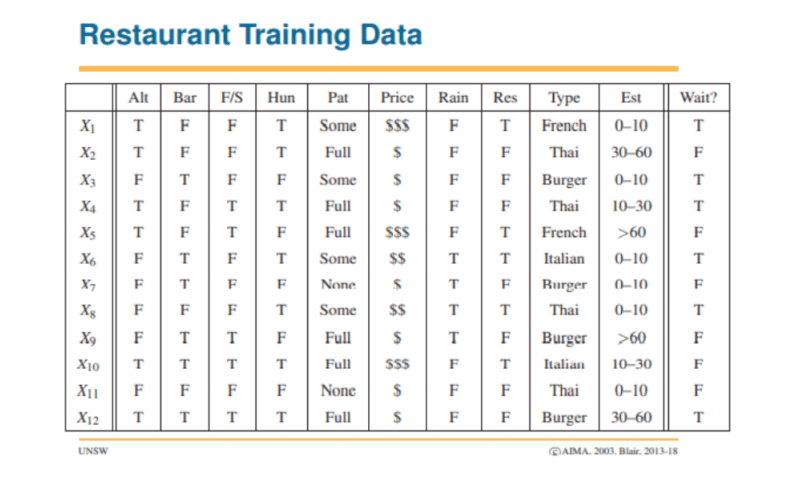
The above table can be delineated into a tree-like structure known as a Decision Tree where each node is a possible option represented in the data above.
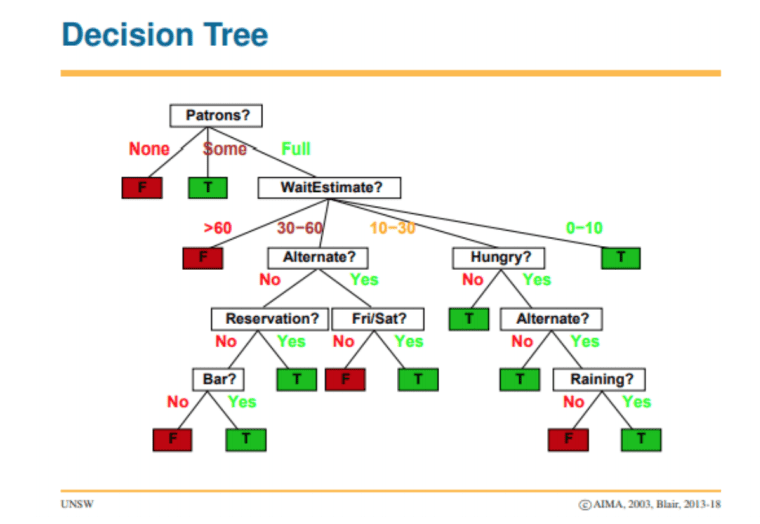
In order that anyone traversing the tree can get to a solution quickly we need to choose and split attributes in such a way that the tree is as small as possible. In this vein, attributes that split data as fully as possible into sets of one type or another are seen to be more “informative” and “orderly”. The measure of lack of order in a tree is called “entropy” and our aim is to reduce it at every step.

Splitting by “patrons”, since it produces two branches with data of just one category, results in lower entropy than for Type.

Paul Maxwell-Walters
A British software tester based in Sydney, Australia with about 10 years of experience testing in agriculture, financial services, digital media and energy consultancy. Paul is a co-chair and social media officer at the Sydney Testers Meetup Group, along with having spoken at several conferences in Australia. Paul blogs on issues in IT and testing at http://testingrants.blogspot.com.au and tweets on testing and IT matters at @TestingRants.
